PITCHvr™ Hitter
Introducing PITCHvr™ Hitter, the revolutionary virtual reality baseball training tool developed by Dr. Mark Jupina and brought to you by Novation Tech LLC. Utilizing the PITCHvr™ instrumented Wildbat™ – a physical, wireless baseball bat equipped with advanced sensors – this innovative software provides real-time, high-sample rate analysis of a player’s swing in relation to a wide variety of virtual reality pitched balls from high school level to professional level.
With PITCHvr™ Hitter, coaches and players can access a range of metrics, including those related to timing, bat swing and pitch ball, bat swing kinematics, and hit ball flight. These metrics provide valuable insights and help players fine-tune their techniques for maximum performance on the field.
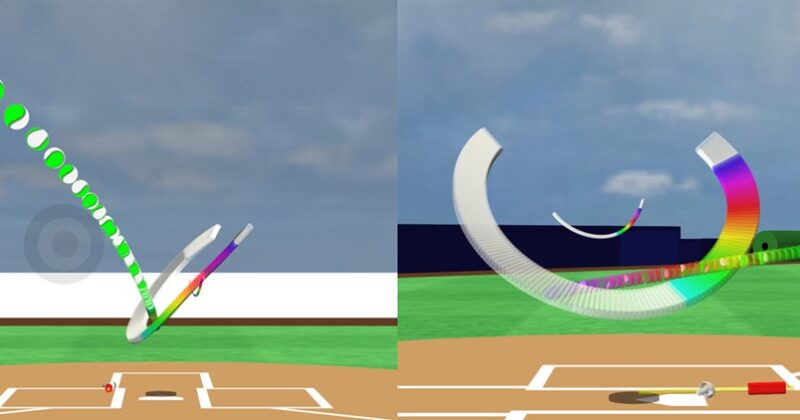
Check out the accompanying sample graphic and spray chart to see how PITCHvr™ Hitter can help you take your game to the next level. So why wait? Start using PITCHvr™ Hitter today, and start seeing real results.
TIMING METRICS
1. Launch Time After Pitch Release measures the amount of time in seconds between pitch release and the start of the swing. The event of swing launch is illustrated using a white sphere on the pitched ball path in the virtual realm so that the user can obtain a more physical understanding between the timing of the swing launch in relation to the speed of the pitch.
2. Launch Time Before Home Plate Crossing measures the amount of time in seconds between the start of the swing and when the pitch crosses the front of home plate.
3. Time to Contact measures the amount time in seconds between the start of the swing and when bat-barrel contact occurs or when the nearest distance between the ball and barrel occurs. The event of ball-barrel contact or minimum distance between the ball and barrel during the swing is illustrated using a black sphere on the pitched ball path and a black cylinder on the barrel swing path in the virtual realm so that the user can obtain a physical understanding of where contact or the nearest point to contact has occurred.
4. Bat vs. Ball Arrival Time measures the relative arrival time of the ball and bat across home plate in seconds. A positive time value means that the bat arrived at home plate first so if contact is made then contact occurs around the front of home plate and the pitch is pulled. Whereas a negative time value means that the ball arrived at home plate first so if contact occurs then contact occurs around the tip of home plate and the pitch is hit to the opposite field. If this time is zero and contact occurs, then contact occurs over the middle of the plate and the ball is hit up the middle
BAT SWING AND PITCHED BALL METRICS
1. Attack Angle in degrees measures the angle between swing plane of the bat relative to the ground as the bat crosses home plate from back to front. High average hitters have Attack Angles equal to and opposite (negative) of the pitch’s Descent Angle.
2. Vertical Angle in degrees measures the angle between the swing plane of the bat relative to a horizontal plane over home plate in a direction moving laterally from one side of home plate to the other. High average hitters also have Vertical Angles equal to the pitch’s Lateral Angle.
3. Connection Angle in degrees measures the angle between the bat and the player’s torso (tilt of player’s torso determined from HMD orientation) and is measured as the bat crosses over home plate. Hitters with Connection Angles of 90 degrees optimally utilize their body movement in powering the swing.
4. Descent Angle in degrees measures the angle between the trajectory plane of the pitched ball relative to a horizontal plane over home plate as the ball crosses home plate from front to back
5. Lateral Angle in degrees measures the angle between the trajectory plane of the pitched ball relative to a horizontal plane over home plate as the ball crosses home plate from one side to the other side.
BAT SWING KINEMATICS
Experts in the field of Kinesiology, the scientific study of human body movement, will not only find the maximum magnitudes of the velocities and accelerations useful in analyzing and optimizing the swing mechanics of a hitter, but also the relative timing of these maximum magnitude events will provide useful information in evaluating the sequence of movement within the hitter’s swing.
1.The Max Sweet-Spot Speed of the Bat Barrel is measured in MPH during the swing along with the timing of this event in seconds WRT swing launch. The position and orientation of the bat barrel for this event is shown in the swing path of the bat barrel as a white cylinder in the virtual realm.
2. Max Hand Speed is measured in MPH during the swing along with the timing of this event in seconds WRT swing launch. The “hand position” on the bat for this event is shown in the swing path of the bat as a white sphere in the virtual realm. The hand position is denoted as the point on the bat handle that is six inches above the bat knob. Consequently, this is essentially the pivot point on the bat handle between the hitter’s two hands.
3. Max Bat Knob Speed is measured in MPH during the swing along with the timing of this event in seconds WRT swing launch. The position of the bat knob for this event is shown in the swing path of the bat knob as a white cube in the virtual realm.
4. Max Bat Rotational Speed is measured in RPS (revolutions per second) during the swing along with the timing of this event in seconds WRT swing launch. A long white rod in the virtual realm is used to illustrate in the bat swing path where this event occurs.
5. Max Bat Knob Acceleration is measured in g’s (1 g = 9.81 m/s2) during the swing along with the timing of this event in seconds WRT swing launch. The position of the bat knob for this event is shown in the swing path of the bat knob as a black cube in the virtual realm.
6. Max Bat Rotational Acceleration is measured in RPS2 (revolutions per second squared) during the swing along with the timing of this event in seconds WRT swing launch. A long black rod in the virtual realm is used to illustrate in the bat swing path where this event occurs.
HIT BALL FLIGHT METRICS (if ball-barrel contact occurs)
1. The Exit Velocity of the hit ball at contact is measured in MPH. Exit Velocities greater that 95 MPH with Launch Angles between 25 and 30 degrees tend to enhance the likelihood that a home run will occur.
2. The Launch Angle is measured in degrees and is the angle between the direction of the hit ball’s trajectory off the bat and the ground. Launch Angles between 25 and 30 degrees with Exit Velocities greater than 95 degrees tend to enhance the likelihood that a home run will occur.
3. The Direction Angle is measured in degrees and is the angle that provides the direction of the hit ball relative to “up the middle” or the center of the baseball diamond. For example, the Direction Angle is 0 degrees for a ball hit directly toward second base, the Direction Angle is 45 degrees for a ball hit down the first base line, the Direction Angle is -45 degrees for a ball hit down the third base line, and the Direction Angle is -180 or 180 degrees for a foul ball hit straight back. Direction Angles with magnitudes between 45 and 180 degrees denote foul balls.
4. Flight Distance is measured in feet and denotes the total distanced that the hit baseball has traveled before hitting the ground.
5. Hang Time is measured in seconds and denotes the total time that the hit baseball has traveled in the air before hitting the ground.
6. Hit Probability is measured as a percentage (%) and provides the degree of likelihood that the outcome of the hit ball is a hit. Players who hit for high average would want to achieve percent values as large as possible (max is 100%).
7. Home Run Probability is measured as a percentage (%) and provides the degree of likelihood that the outcome of the hit ball is a home run. Players who are power hitters would want to achieve percent values as large as possible (max is 100%).


